Real biometric data from HealthKit, Strava, Garmin, Wahoo, and file imports (GPX/TCX/FIT) — analyzed with peer-reviewed sports science and an AI coach that understands your training history, recovery state, and goals.


Performance Analytics
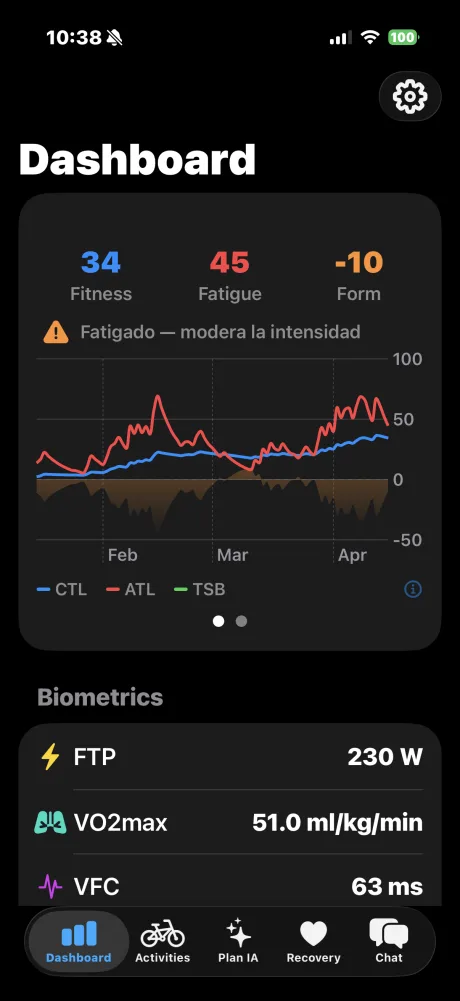
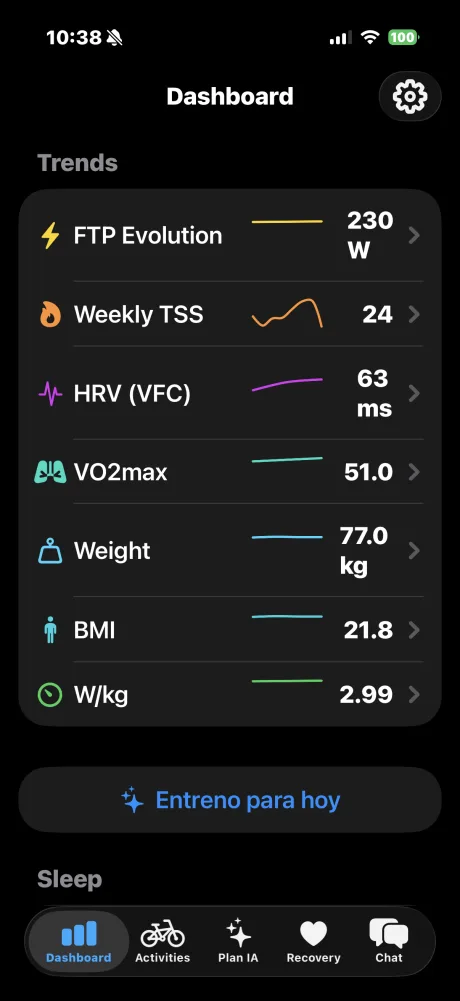
Monitor your FTP evolution, weekly Training Stress Score, HRV variability, VO2max, weight, BMI, and watts per kilo — all in one place. Each metric includes a sparkline trend and full history with manual entry support.
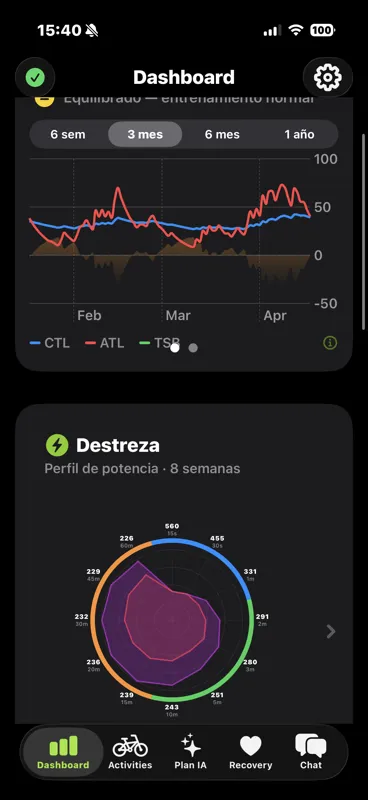
The Performance Management Chart tracks your Chronic Training Load (fitness, 42-day average), Acute Training Load (fatigue, 7-day average), and Training Stress Balance (form = CTL − ATL) using the Banister impulse-response model.

Recovery & Readiness
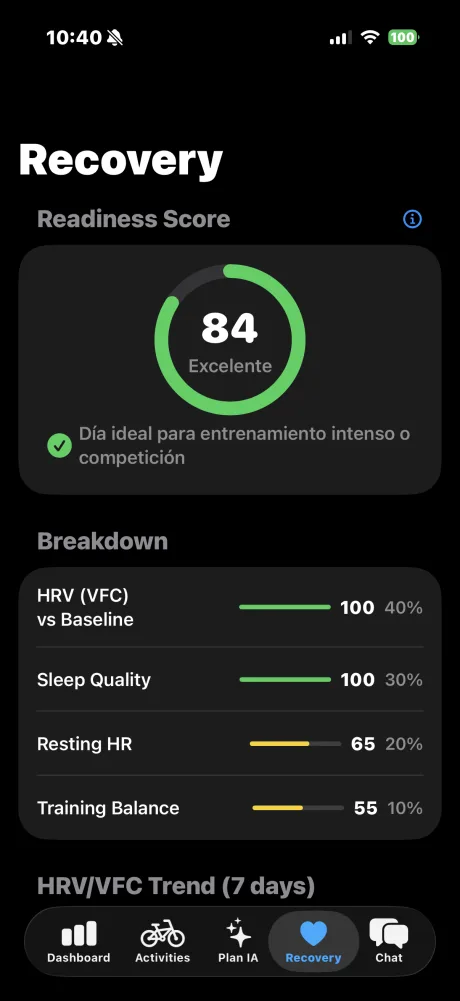
The Readiness Score (0–100) combines four science-backed factors to tell you whether to push hard, go easy, or rest. No guesswork — just data.
Based on Manresa-Rocamora et al. (2021) meta-analysis and Plews et al. (2013) rMSSD research for autonomic recovery monitoring.


Activities & Power
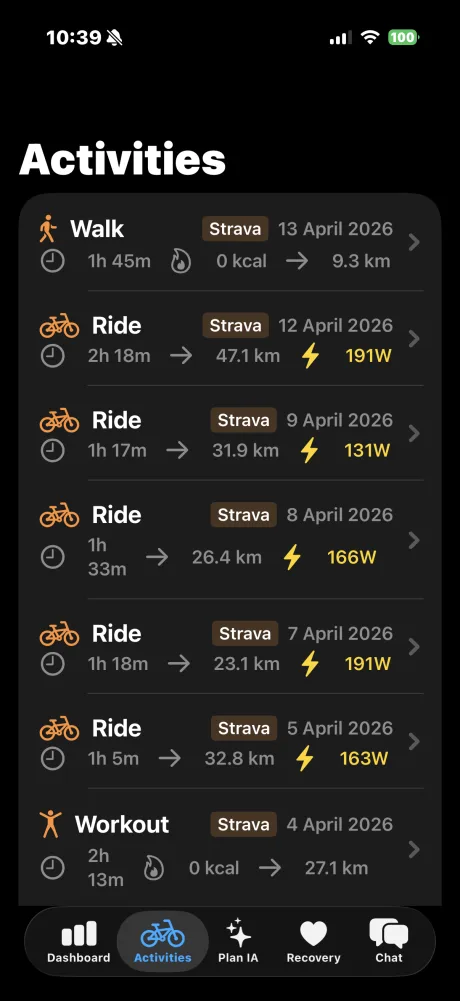
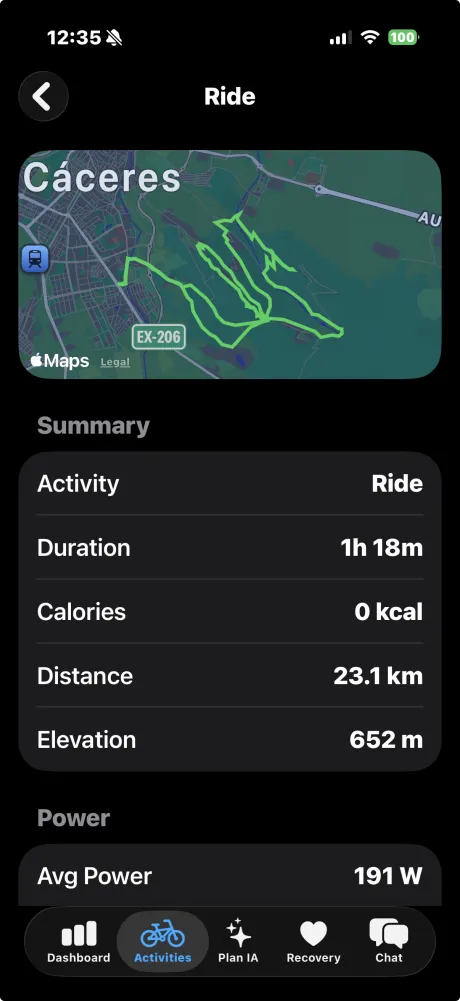
Activities from HealthKit and Strava are merged and deduplicated automatically. Each ride shows Normalized Power, Intensity Factor, TSS, Variability Index, and 7-zone power distribution based on Coggan & Allen methodology.
Tap any activity for a full breakdown: power zones, heart rate zones, and an AI-powered analysis that explains the physiological benefits of the session, identifies strengths, and suggests improvements — all personalized to your FTP and fitness level at the time of the ride.


Stream Analysis
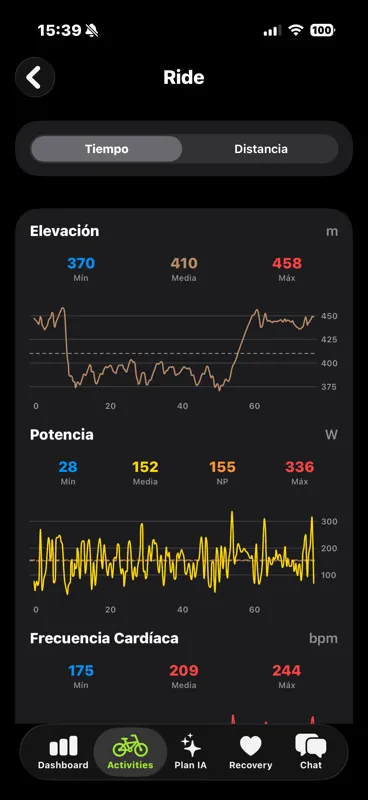
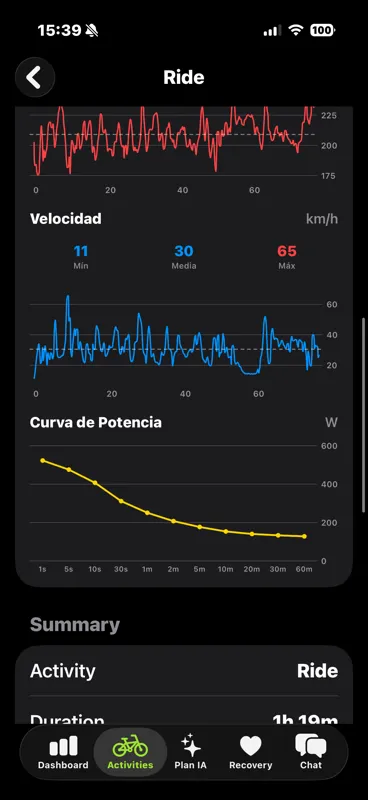
Detailed second-by-second charts for elevation, power, heart rate, and speed — with min, average, and max values. Toggle between time and distance on the X-axis. Power chart includes Normalized Power line for instant comparison.
The Power Curve shows your best average power from 1 second to 60 minutes, revealing your strengths across sprint, attack, and endurance durations.


Power Profile
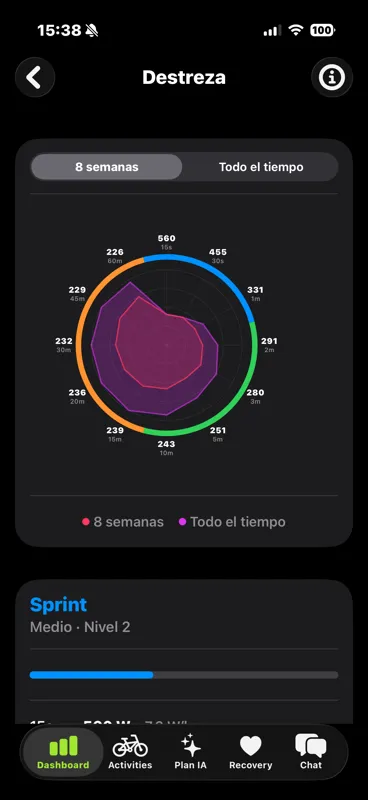
The Destreza radar chart maps your power across 12 durations (15s to 60min), revealing whether you're a sprinter, attacker, or climber. Compare your last 8 weeks against your all-time bests to track progression.
Three categories — Sprint, Attack, and Climb — each with a level from Beginner to Pro based on your W/kg, following Coggan's power profile tables.

Activity Calendar
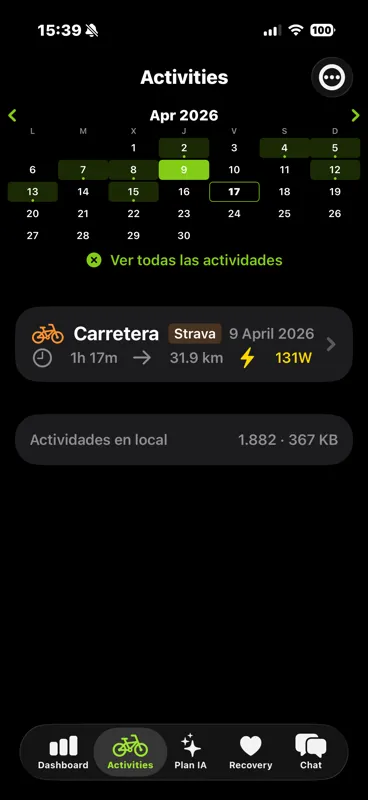
A compact monthly calendar highlights every day you trained. Tap any day to filter activities instantly. Download up to a year of history from Strava or HealthKit with one tap, with deduplication that always keeps the richest data source.

AI Coach
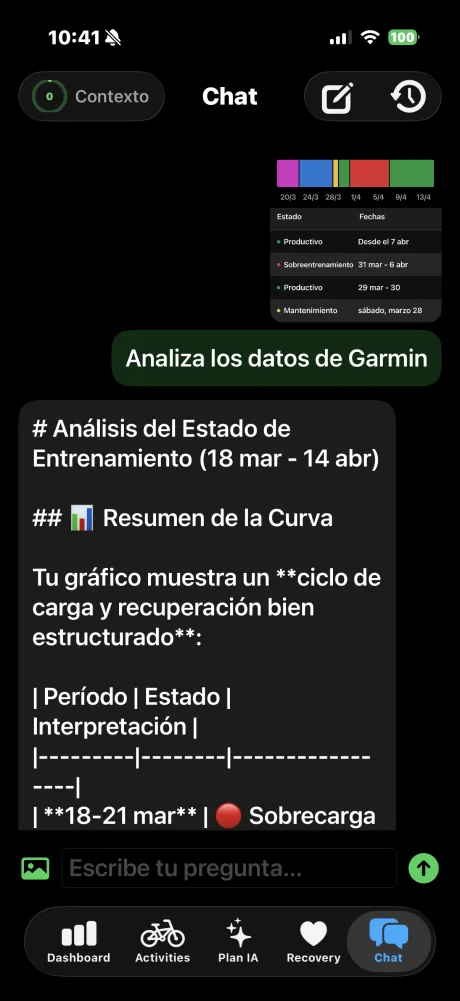
Chat with Claude AI (via AWS Bedrock) that has persistent context of your profile, biometric data, training load, recovery state, and the last 45 days of activities. Ask anything — from "should I train hard today?" to "analyze my nutrition after yesterday's ride."
Recommendations grounded in Nature 2025 individualized vmHRV protocols and Frontiers in Nutrition 2025 post-exercise nutrition meta-analysis.


AI Training Plans
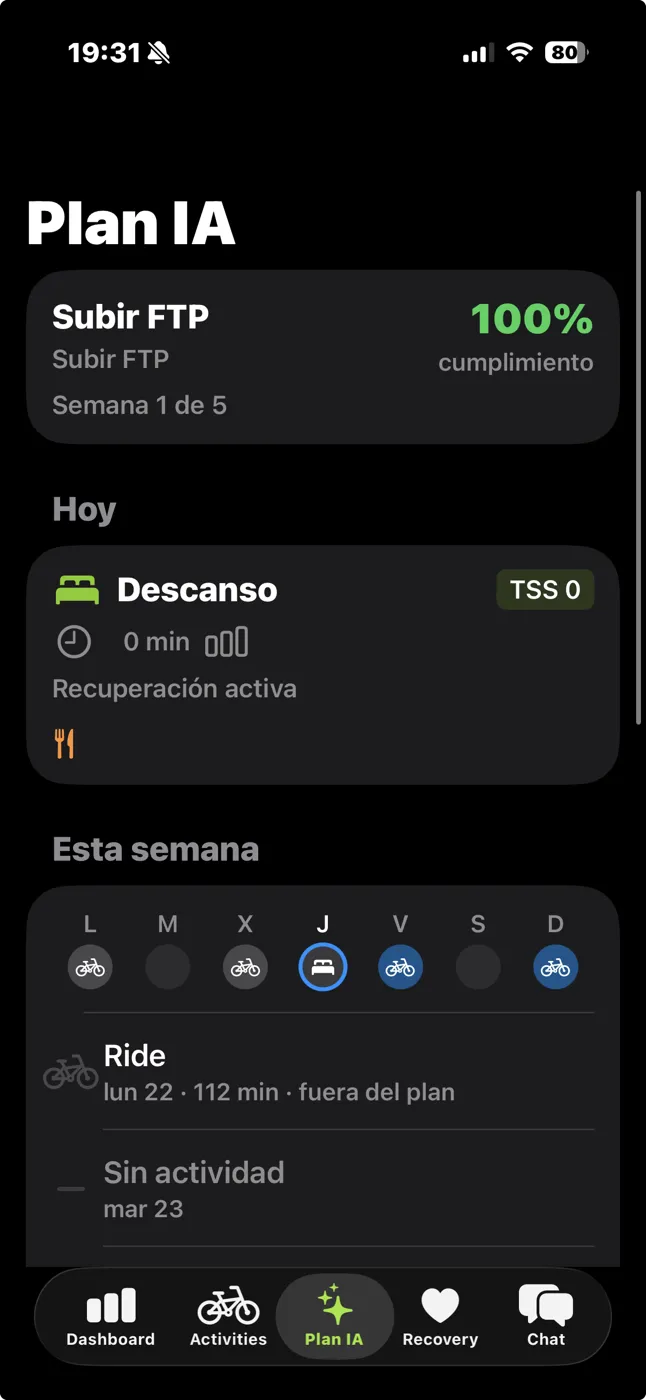
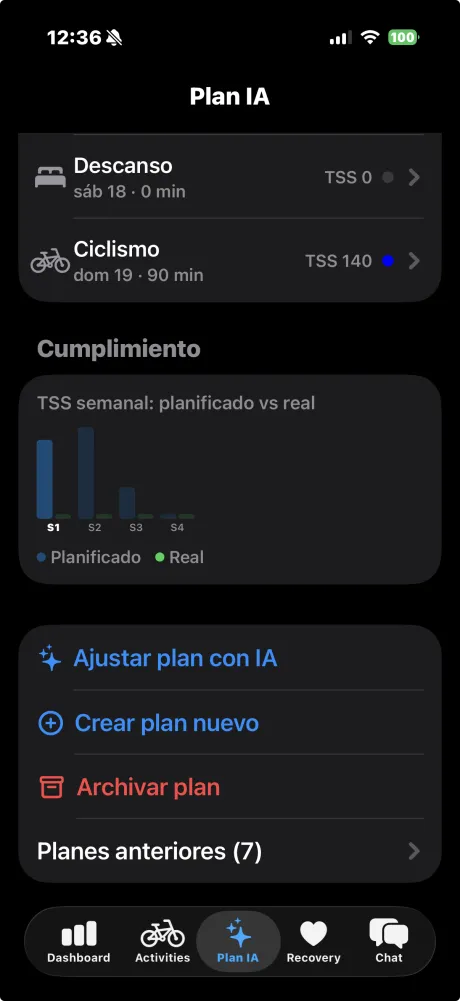
Tell Claude your goal, available days, and timeline. The AI generates a complete periodized plan with structured workouts, target TSS, power zones, and post-workout nutrition — all based on your current fitness, recovery state, and training history.


Structured Workouts
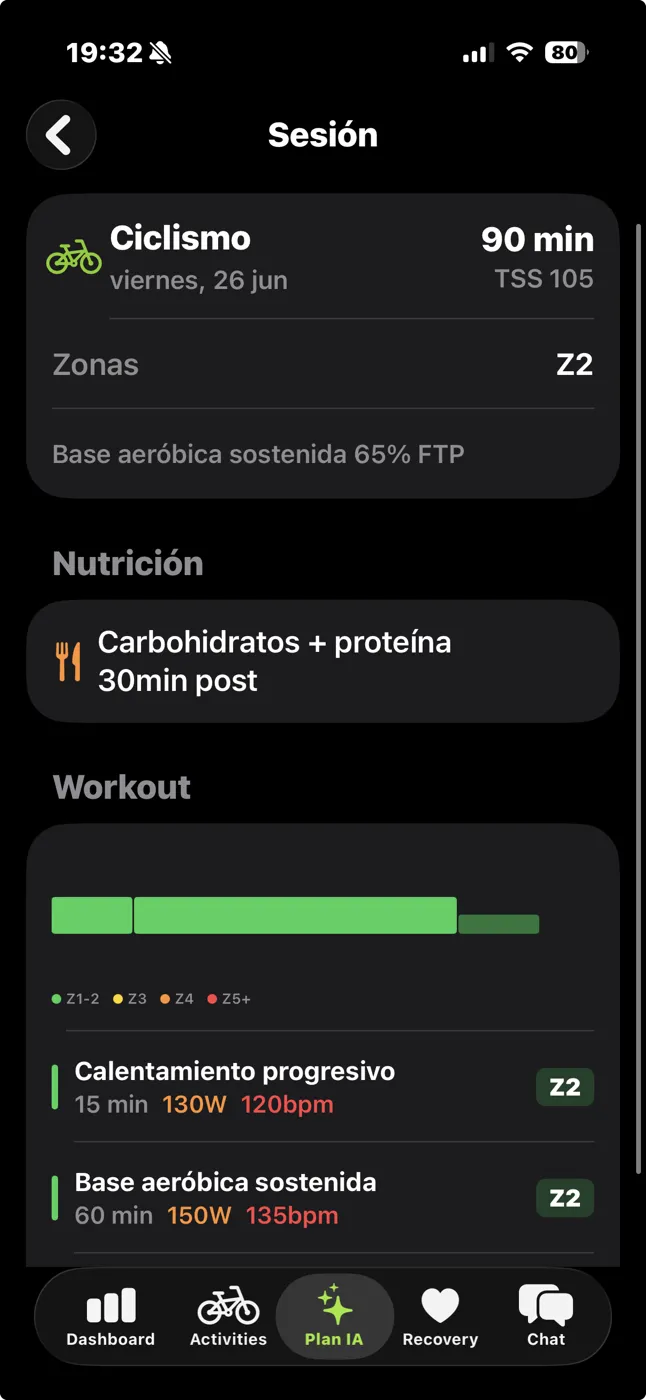
Tap any session in your plan and the AI generates a complete structured workout with exact power targets, heart rate zones, and timing — the same quality you'd get from a professional coach, personalized to your FTP and fitness level.
Each workout includes a visual intensity chart showing the full session at a glance: green blocks for warmup and recovery, orange for tempo, red for threshold intervals. Below, every block is detailed with watts, heart rate, duration, and zone — ready to follow on your bike computer.
Integrations
Connect your devices and platforms for a complete picture of your training and recovery.
Connected
Connected
Coming Soon
Connected
.gpx .tcx .fit
AI Engine

iOS Widgets
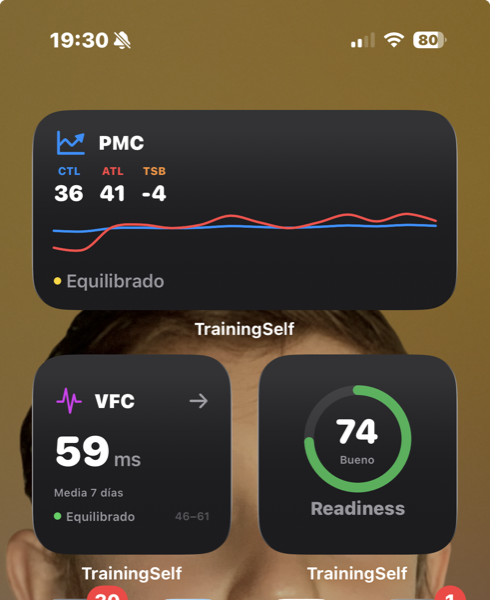
Check your status at a glance without opening the app. Three widgets designed for athletes: training load (PMC with CTL/ATL chart), recovery level (Readiness Score), and heart rate variability (HRV with trend and baseline range).
Evidence-Based
Every algorithm and recommendation is backed by published, peer-reviewed research.
Coggan & Allen (2003) — NP, IF, TSS as validated metrics for cycling training. Banister (1975) — CTL/ATL/TSB impulse-response model with 42-day and 7-day time constants.
Manresa-Rocamora et al. (2021) — Meta-analysis confirming HRV-guided training improves aerobic performance. Plews et al. (2013) — rMSSD as primary recovery metric.
Plews et al. (2013) — Optimal range calculated as mean ± 1 SD of the last 30 days of nocturnal rMSSD. Minimum 7 samples required. 7-day moving average smooths daily variability. CV < 5% indicates good adaptation; CV > 10% suggests stress or poor recovery. Esco et al. (2025) validates mobile device HRV monitoring.
PMC9517884 (2022) — Recovery requires more time with age; load management is critical. Nature 2025 — Individualized vmHRV protocols improve cycling performance.
Frontiers in Nutrition (2025) — CHO+protein within 30 min post-exercise significantly improves recovery. 1.2g CHO/kg/h for optimal glycogen replenishment.
Roadmap
Continuous improvement driven by real athlete needs.
Heart rate, HRV, sleep, workouts, power data, and activity streams.
NP, IF, TSS, CTL/ATL/TSB, power zones, HR zones, PMC chart.
HRV trends, sleep analysis, resting HR, multi-factor readiness assessment.
Claude via AWS Bedrock with full user profile, training history, and image analysis.
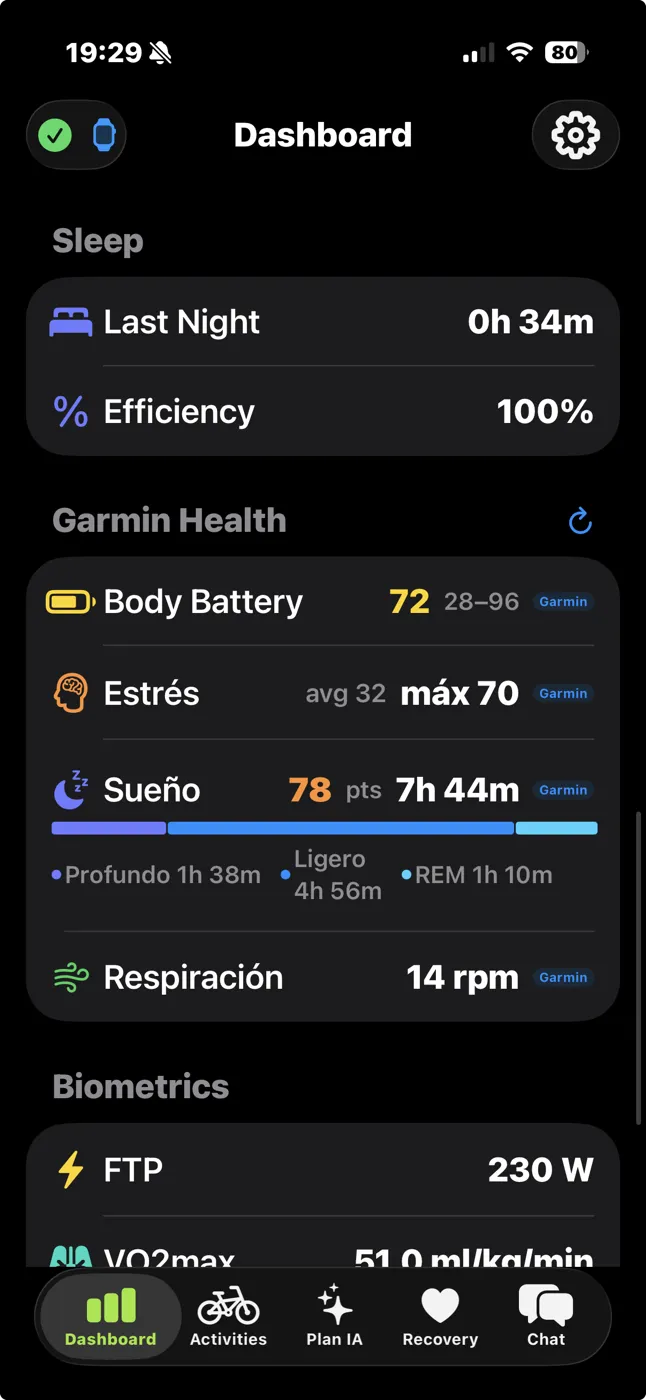
Health API (HRV nocturno, Body Battery, Stress), Activity API (FIT files), Training API.
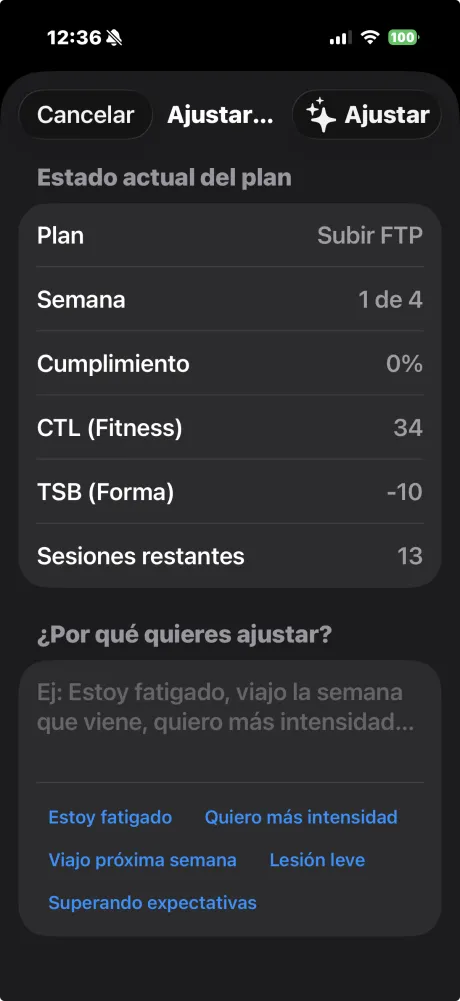
Personalized periodized plans, compliance tracking, dynamic adjustments, nutrition guidance.
Import GPX, TCX, and FIT files from any device or platform. Protected from auto-cleanup.
Push AI-generated workouts directly to Edge/Fenix/Forerunner via Training API.
OAuth2 PKCE connection, activity sync, power zones. Ready for structured workout push.
Second-by-second elevation, power, HR, speed charts with power curve analysis.
Radar chart with 12 durations, Sprint/Attack/Climb categories, W/kg levels.
Monthly calendar with training day highlights, day filtering, 1-year history download.
PMC with CTL/ATL chart, Readiness Score and HRV on the home screen. Auto-updated data.
Get Started
TrainingSelf combines your biometric data with sports science and AI to help you perform at your best — and recover like a pro.
Get in Touch